The Runtime IDE
Workbench
Build, debug and tune applications from inside the running system, in a browser-based IDE with direct access to live data, components and logic.
Function inside the fabric
Build and debug inside the running system
External IDEs are right for structured projects and source control. But much of the work starts closer to the running system:
- Inspecting a stream or exploring a schema
- Testing a query or reviewing a transformation
- Finding out why an event did not produce the expected result
The Workbench is the browser-based IDE built into AmiCore for exactly that work, with direct access to the live data, components and logic of the current environment, within each user's entitlements.
It shows what an external editor cannot: live state, execution as it happens, and how each procedure interacts with the application around it.
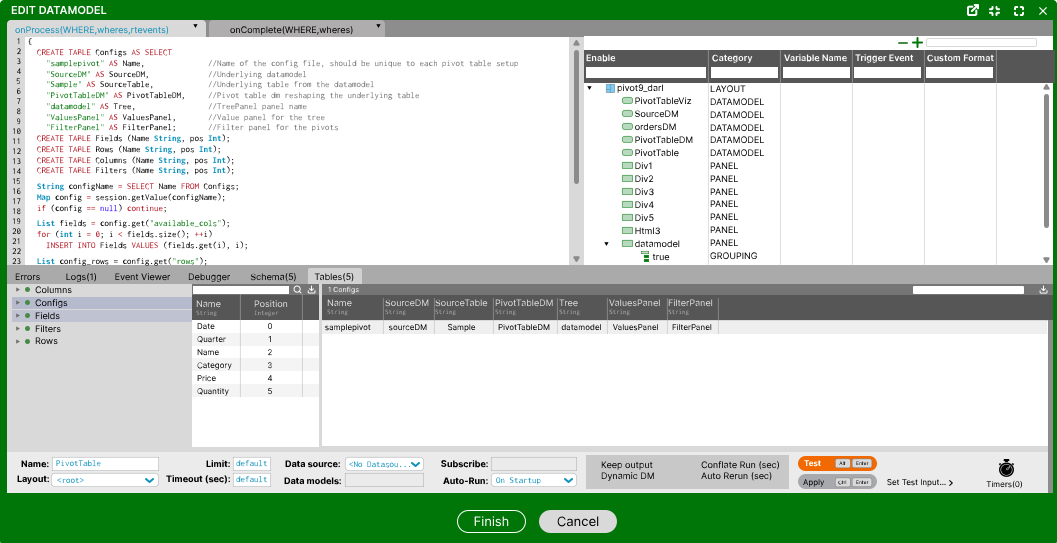
Capabilities
A complete toolkit, in the browser
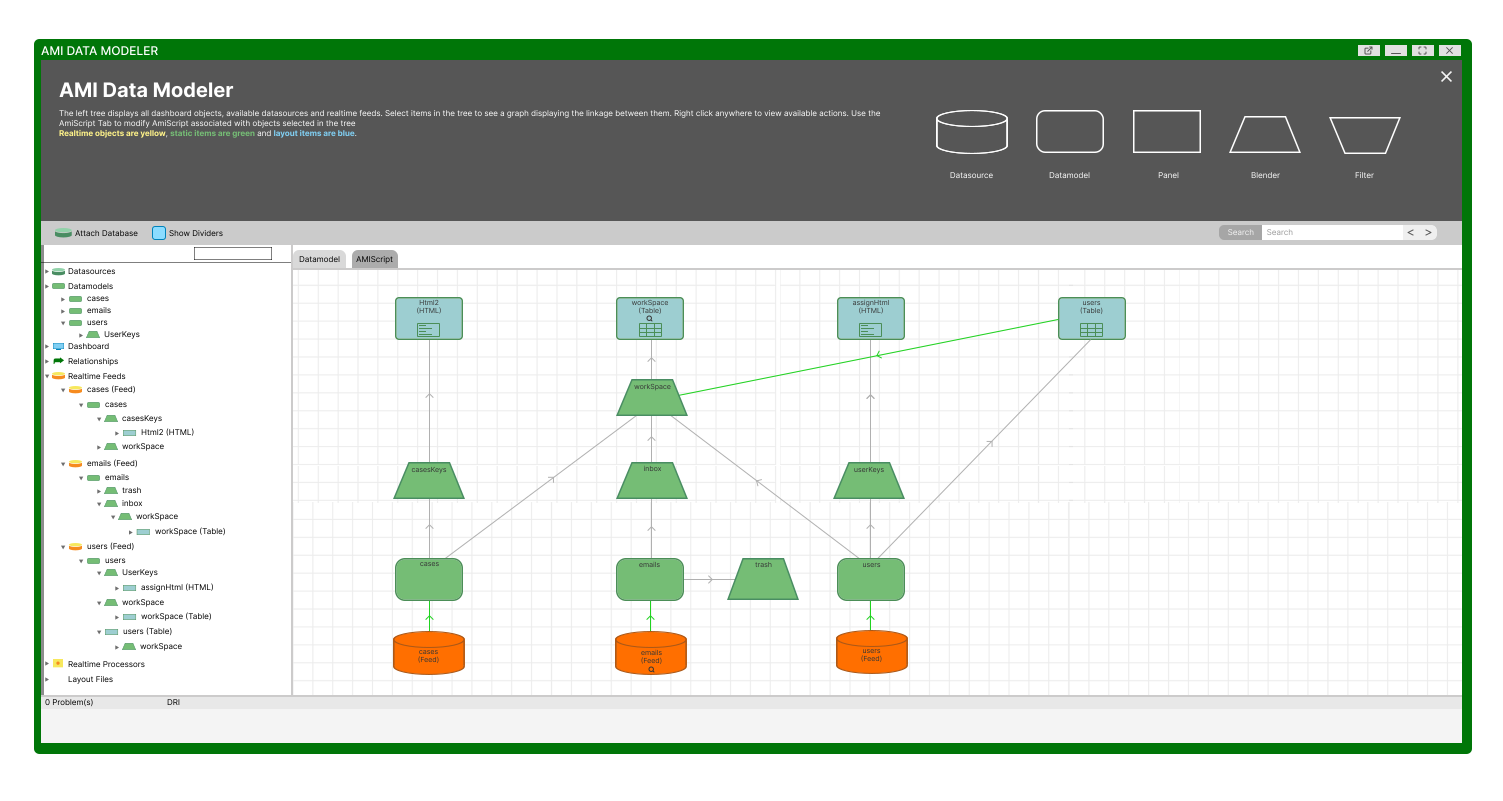
Data Modeler
Design, visually, how data is accessed, transformed and delivered to an application.
- Connect databases, files and real-time feeds
- Filter, join, aggregate and blend with SQL and AmiScript into reusable datamodels
- Edit the data behind every dashboard component, real-time datamodels included
More than a picture of the database: it defines the live processing that turns source data into every table, chart and form users see.
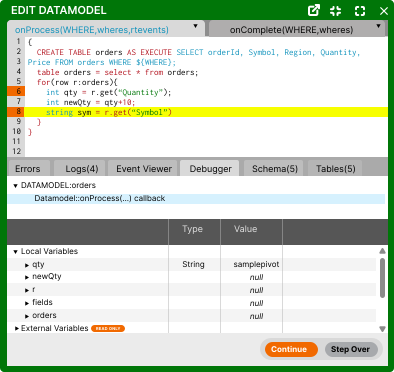
Debugger
Debug AmiScript in the same place it is written.
- Breakpoints on any line, with variables and call stack at every stop
- Callbacks tested against a connected instance, on live or test data rather than a reproduction
- Exploratory changes stay transient until explicitly saved
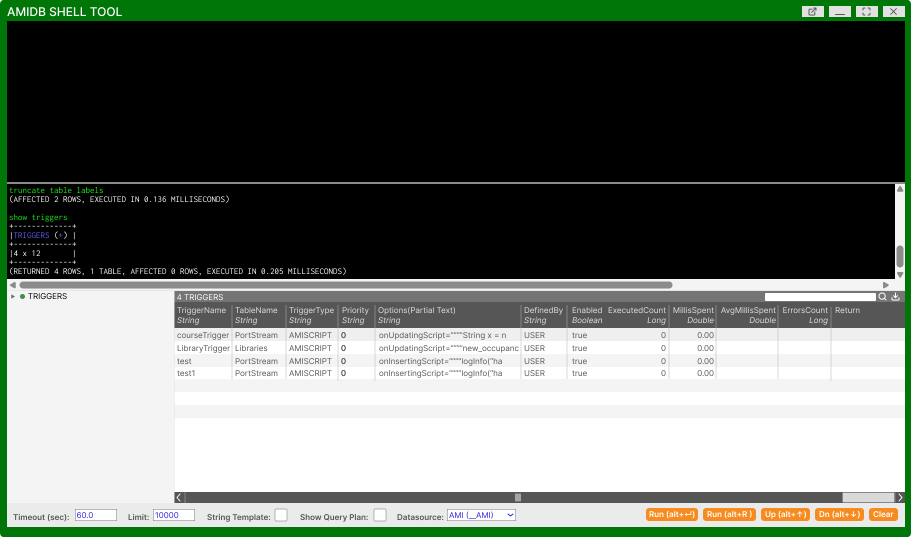
Database Shell
Database and operating-system commands in one shell, in the browser.
- Query, configure and administer the Center in familiar, MySQL-like AMI SQL
- SHOW lists running objects, DESCRIBE returns the SQL to rebuild any of them, DIAGNOSE reports operational detail such as table memory
- Shell commands over SSH, with stdout, stderr and exit code captured
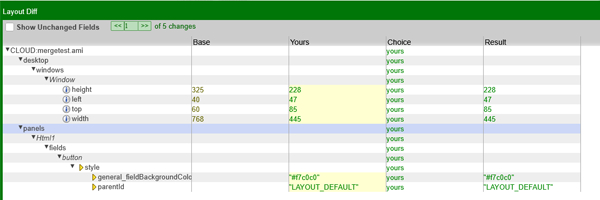
Merge Tool
Combine layout changes from several developers, safely.
- Changes read in the context of the application's structure
- Presented as a navigable tree
- Conflicts pinpointed to the exact element changed twice
F1 Console
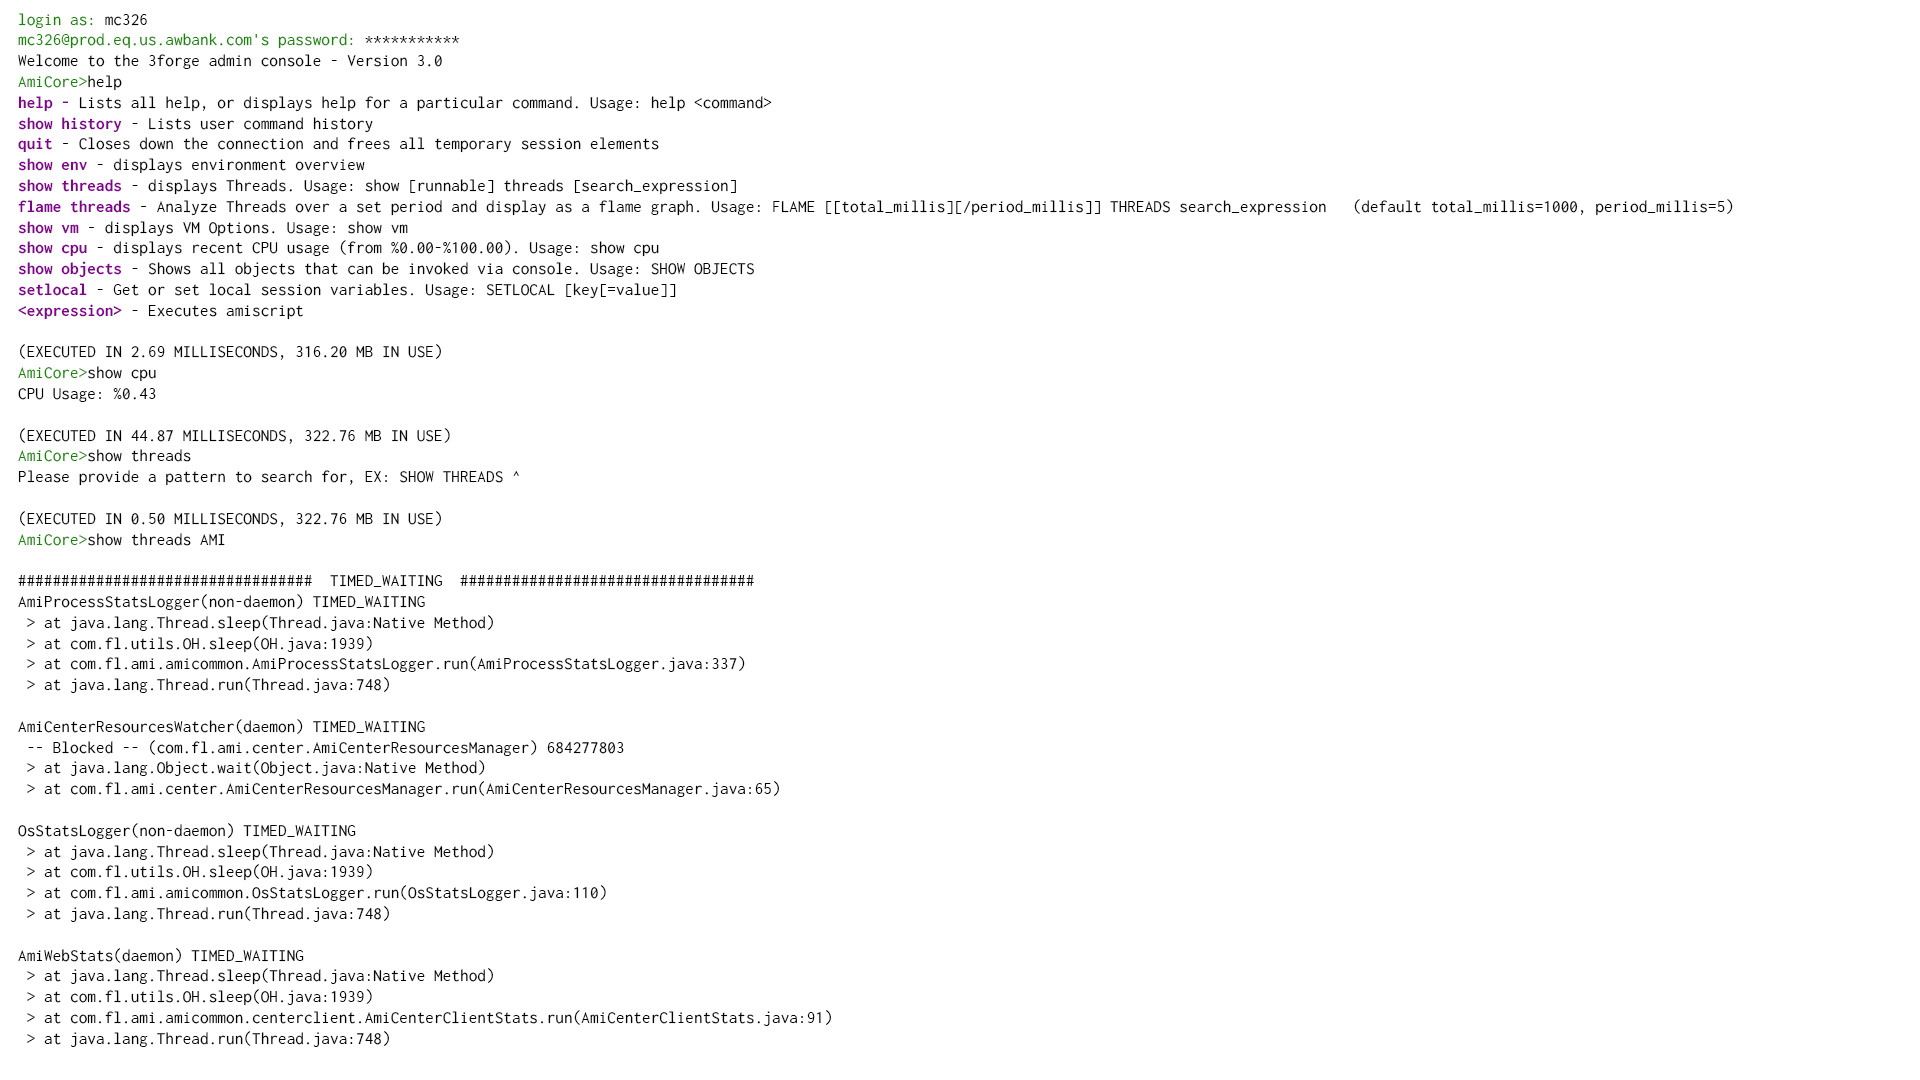
Administer and diagnose a running AMI Web instance.
- Active users, sessions and layouts, and what each consumes
- Terminate sessions and manage headless ones
- Run AmiScript inside a chosen session
Where it matters
Beside the engineering process, not instead of it
The Workbench complements source control and your software-development lifecycle rather than replacing them. It covers the platform directly, while editors such as Visual Studio Code connect through dedicated plugins. See AmiScript and the 3forge Plugin for that path.
- Continuous integration that fits your existing DevOps workflows
- Consistent in every modern browser, with the same functionality and look
- Device agnostic: what you build is fully responsive on desktop, tablet and mobile
Built for scale
Custom Methods
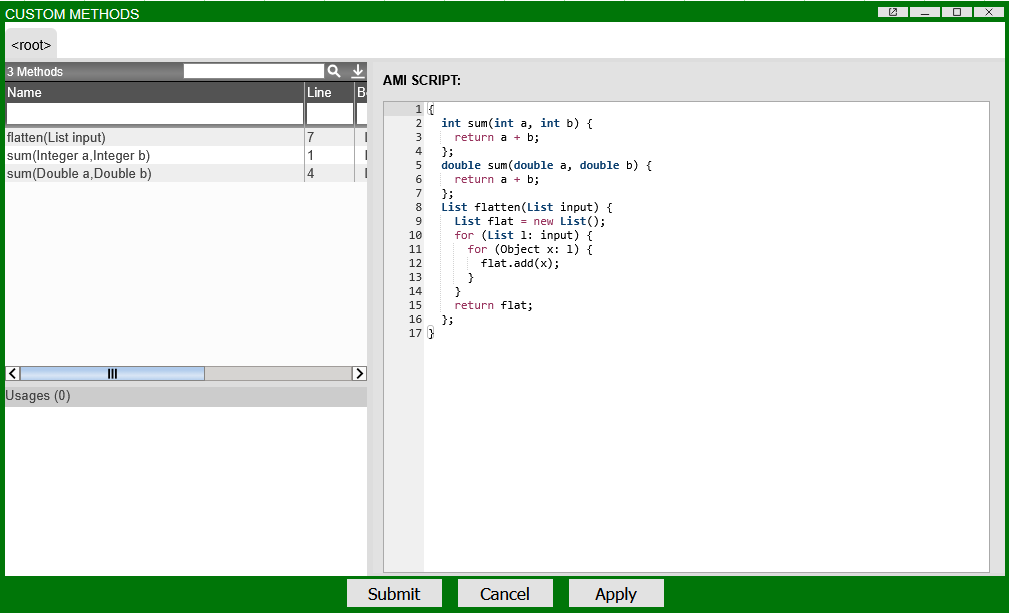
Define logic once and call it from anywhere in a layout: callbacks, buttons, forms, datamodels, visual components and event handlers.
- One definition for each business rule, format, validation or entitlement check
- One place to change it, instead of every panel and script that depends on it
- Cleaner AmiScript, and layouts that behave like well-structured applications
Built-in help
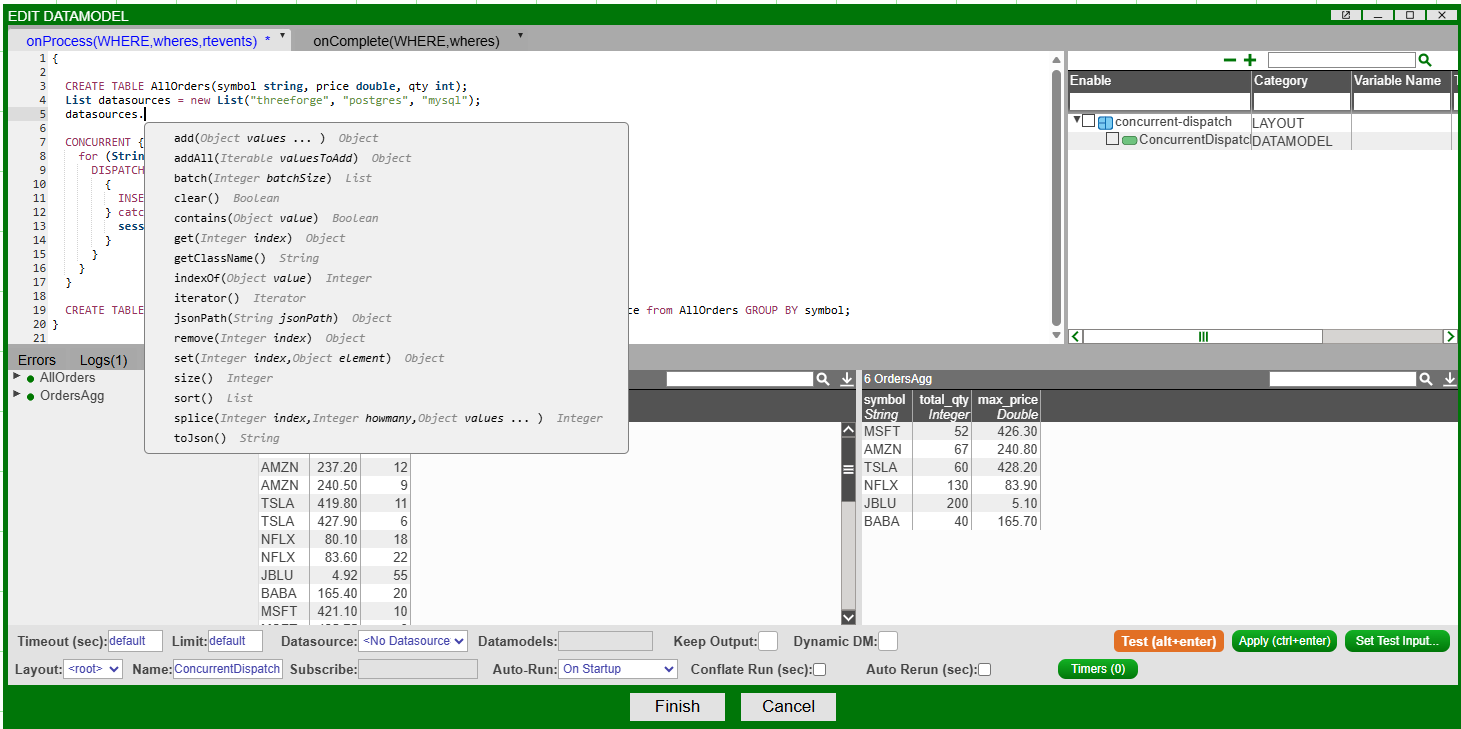
Contextual guidance embedded in the development flow
Guidance appears as you type, not in a separate reference, across Java, Python, SQL and 3forge's finance-native constructs in the same session.
- Parameters, types, return values and usage patterns, surfaced in place
- Driven by the same model that runs the logic, so it always matches the environment exactly
- No need to stop and search the documentation
Performance management at scale
Observe execution in real time, find bottlenecks fast and fix them before users or downstream workflows feel it. Performance visibility is a first-class capability, under real operating conditions.
Deep runtime instrumentation
Execution, data access, latency and throughput, instrumented throughout. Flame thread analysis shows exactly where time goes, so slow paths are found and fixed with precision.
Advanced log viewer
Purpose-built visualizations turn application logs into a clear picture of JVM memory allocation, consumption and headroom, with generated observations to guide the analysis.
End-to-end latency analysis
Latency correlated from event timestamps through every processing stage, in live layouts that surface trends, outliers and drift.
Per-session resource attribution
Resource use inside a single JVM, attributed to individual users and applications: spot imbalances, protect critical users and see what drives load as you scale.
Track virtually any aspect of the engine, from log messages and threads to triggers, load balancing and memory. Shown here: LogViewer.
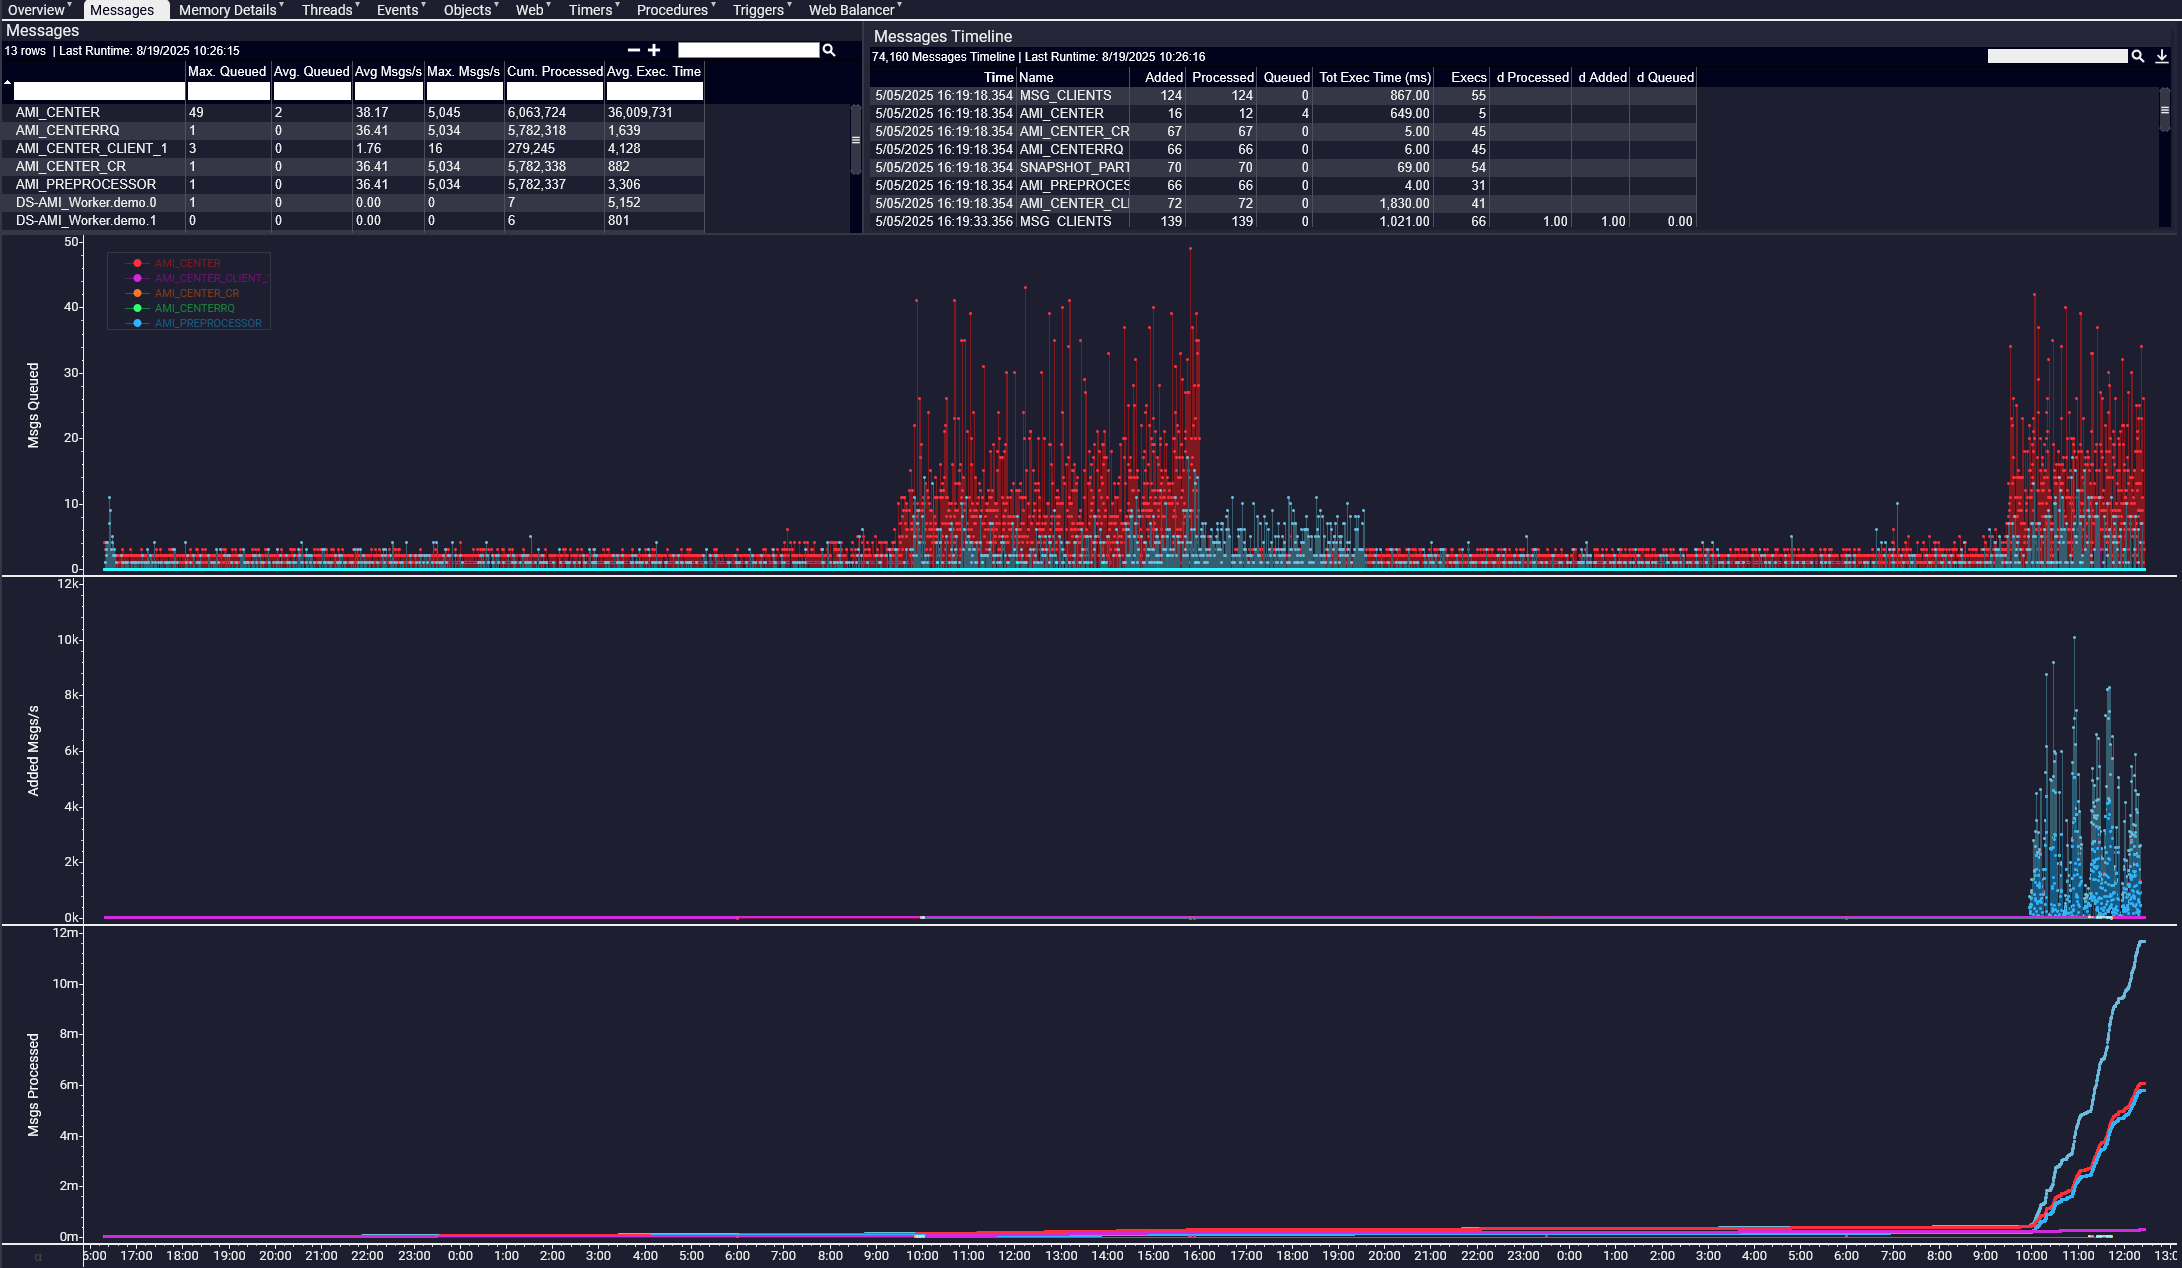
Log message stream
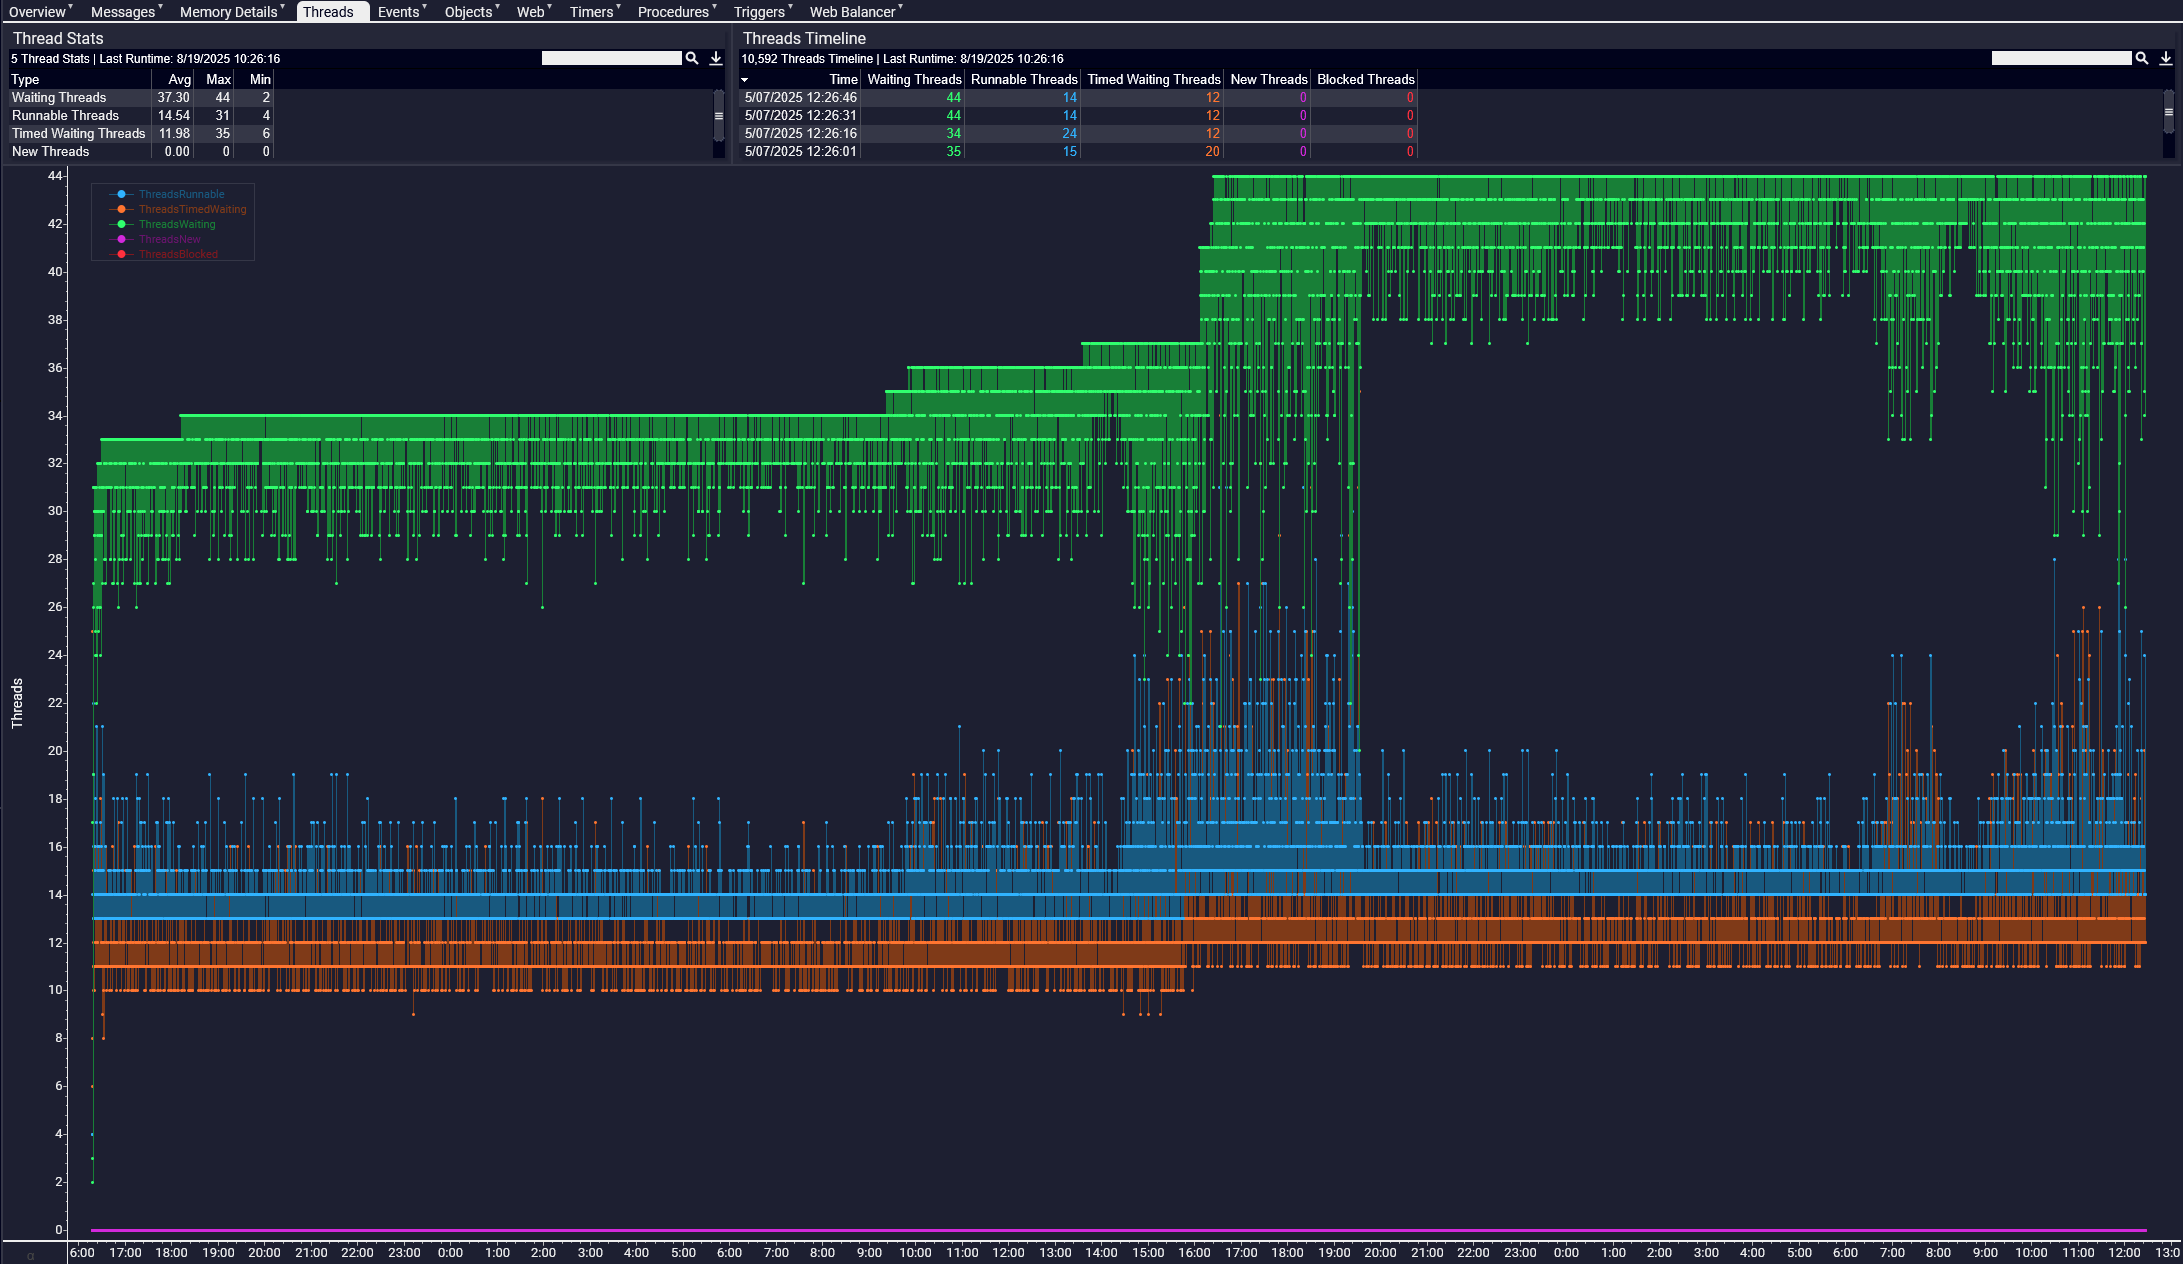
Thread activity
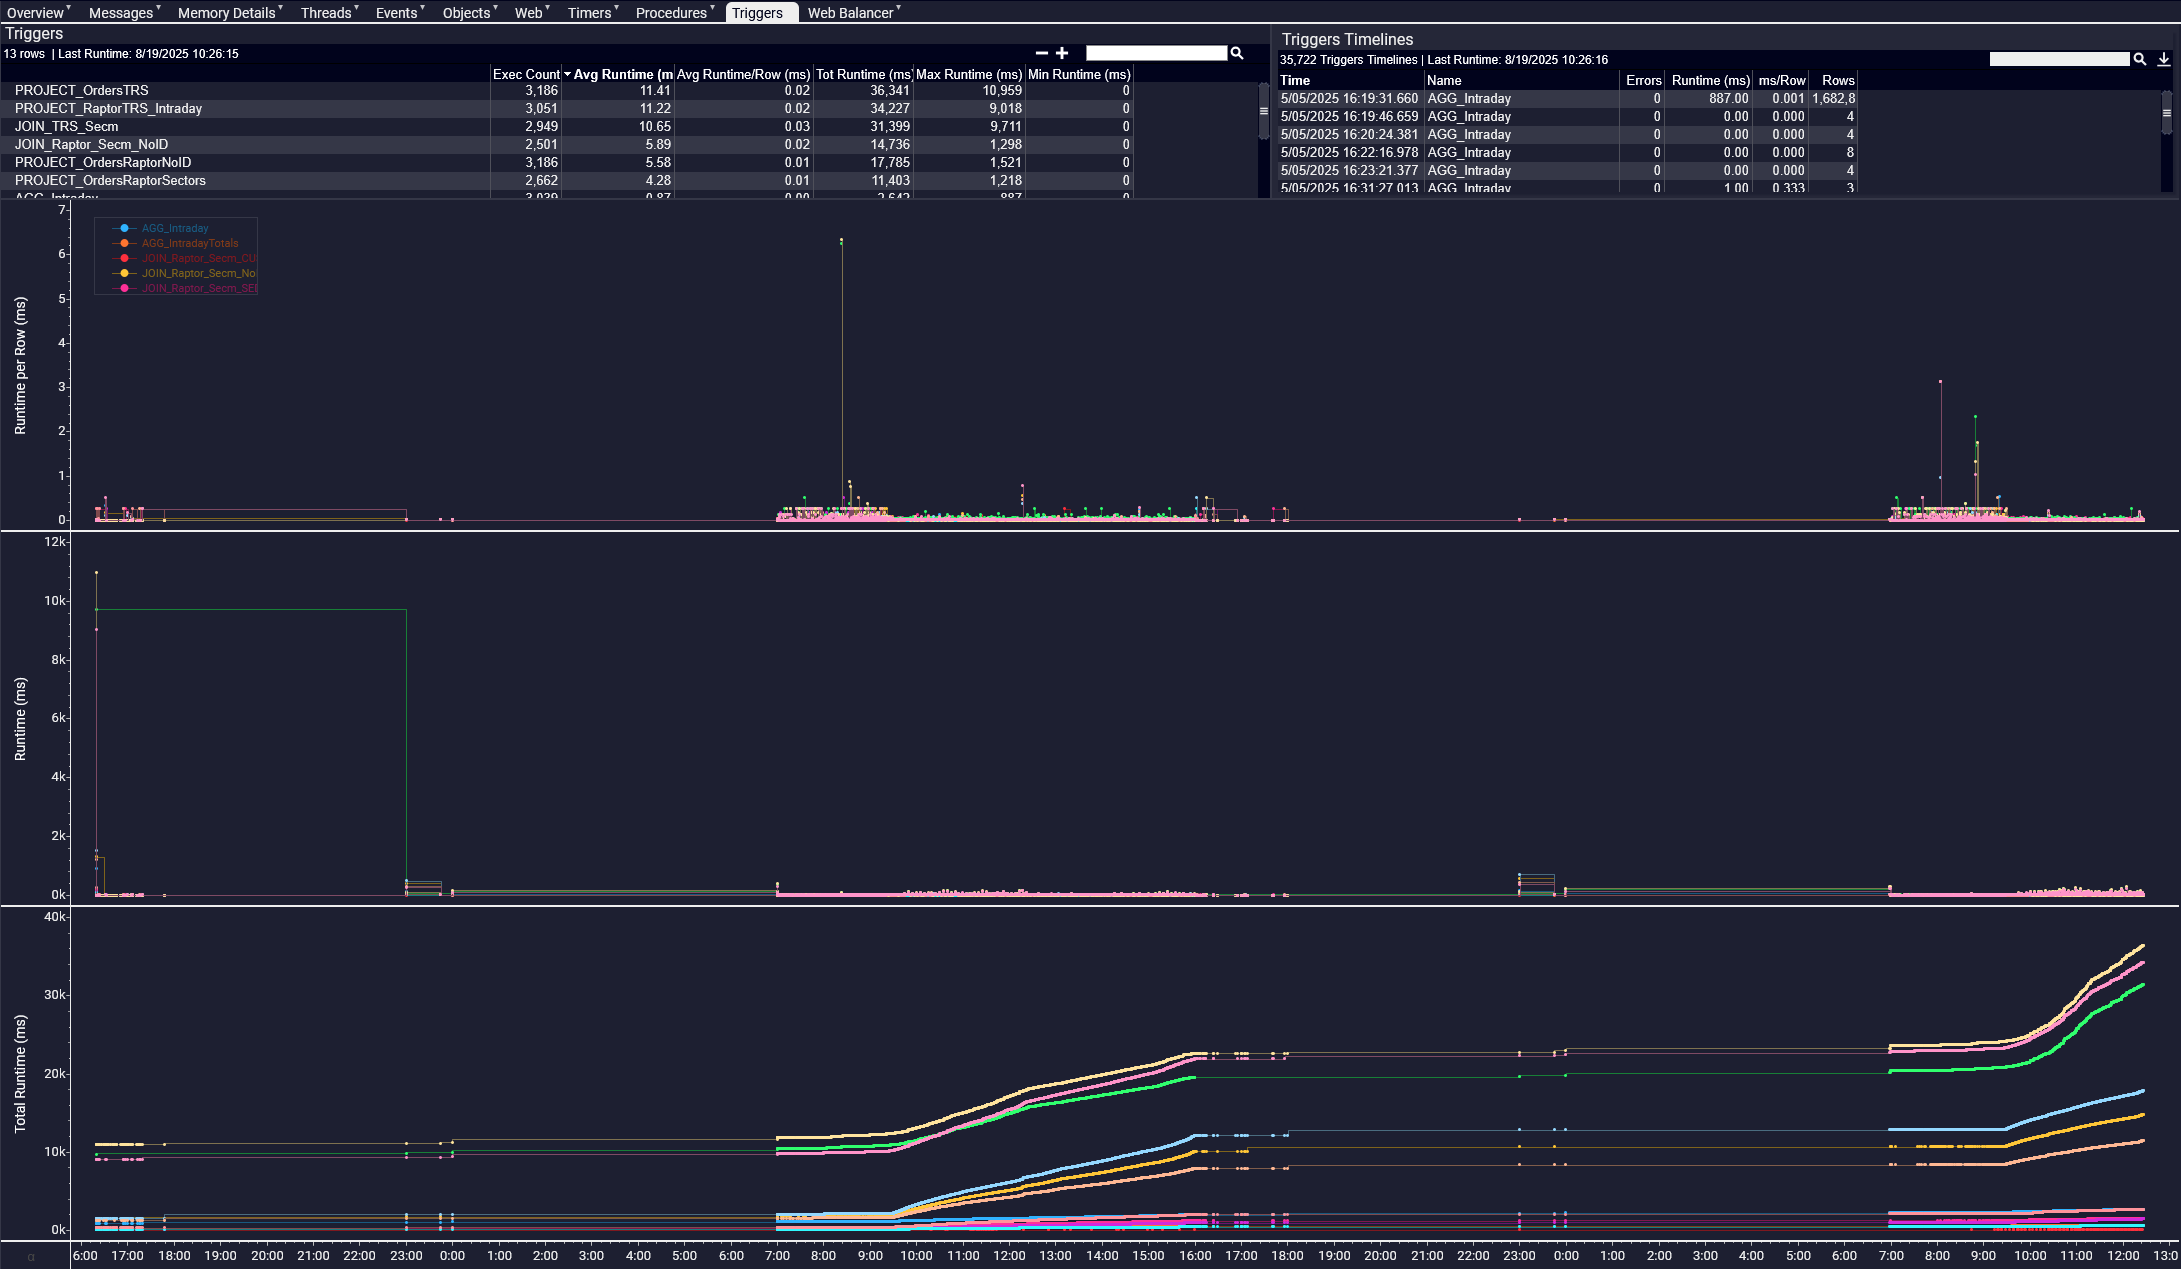
Trigger event timeline
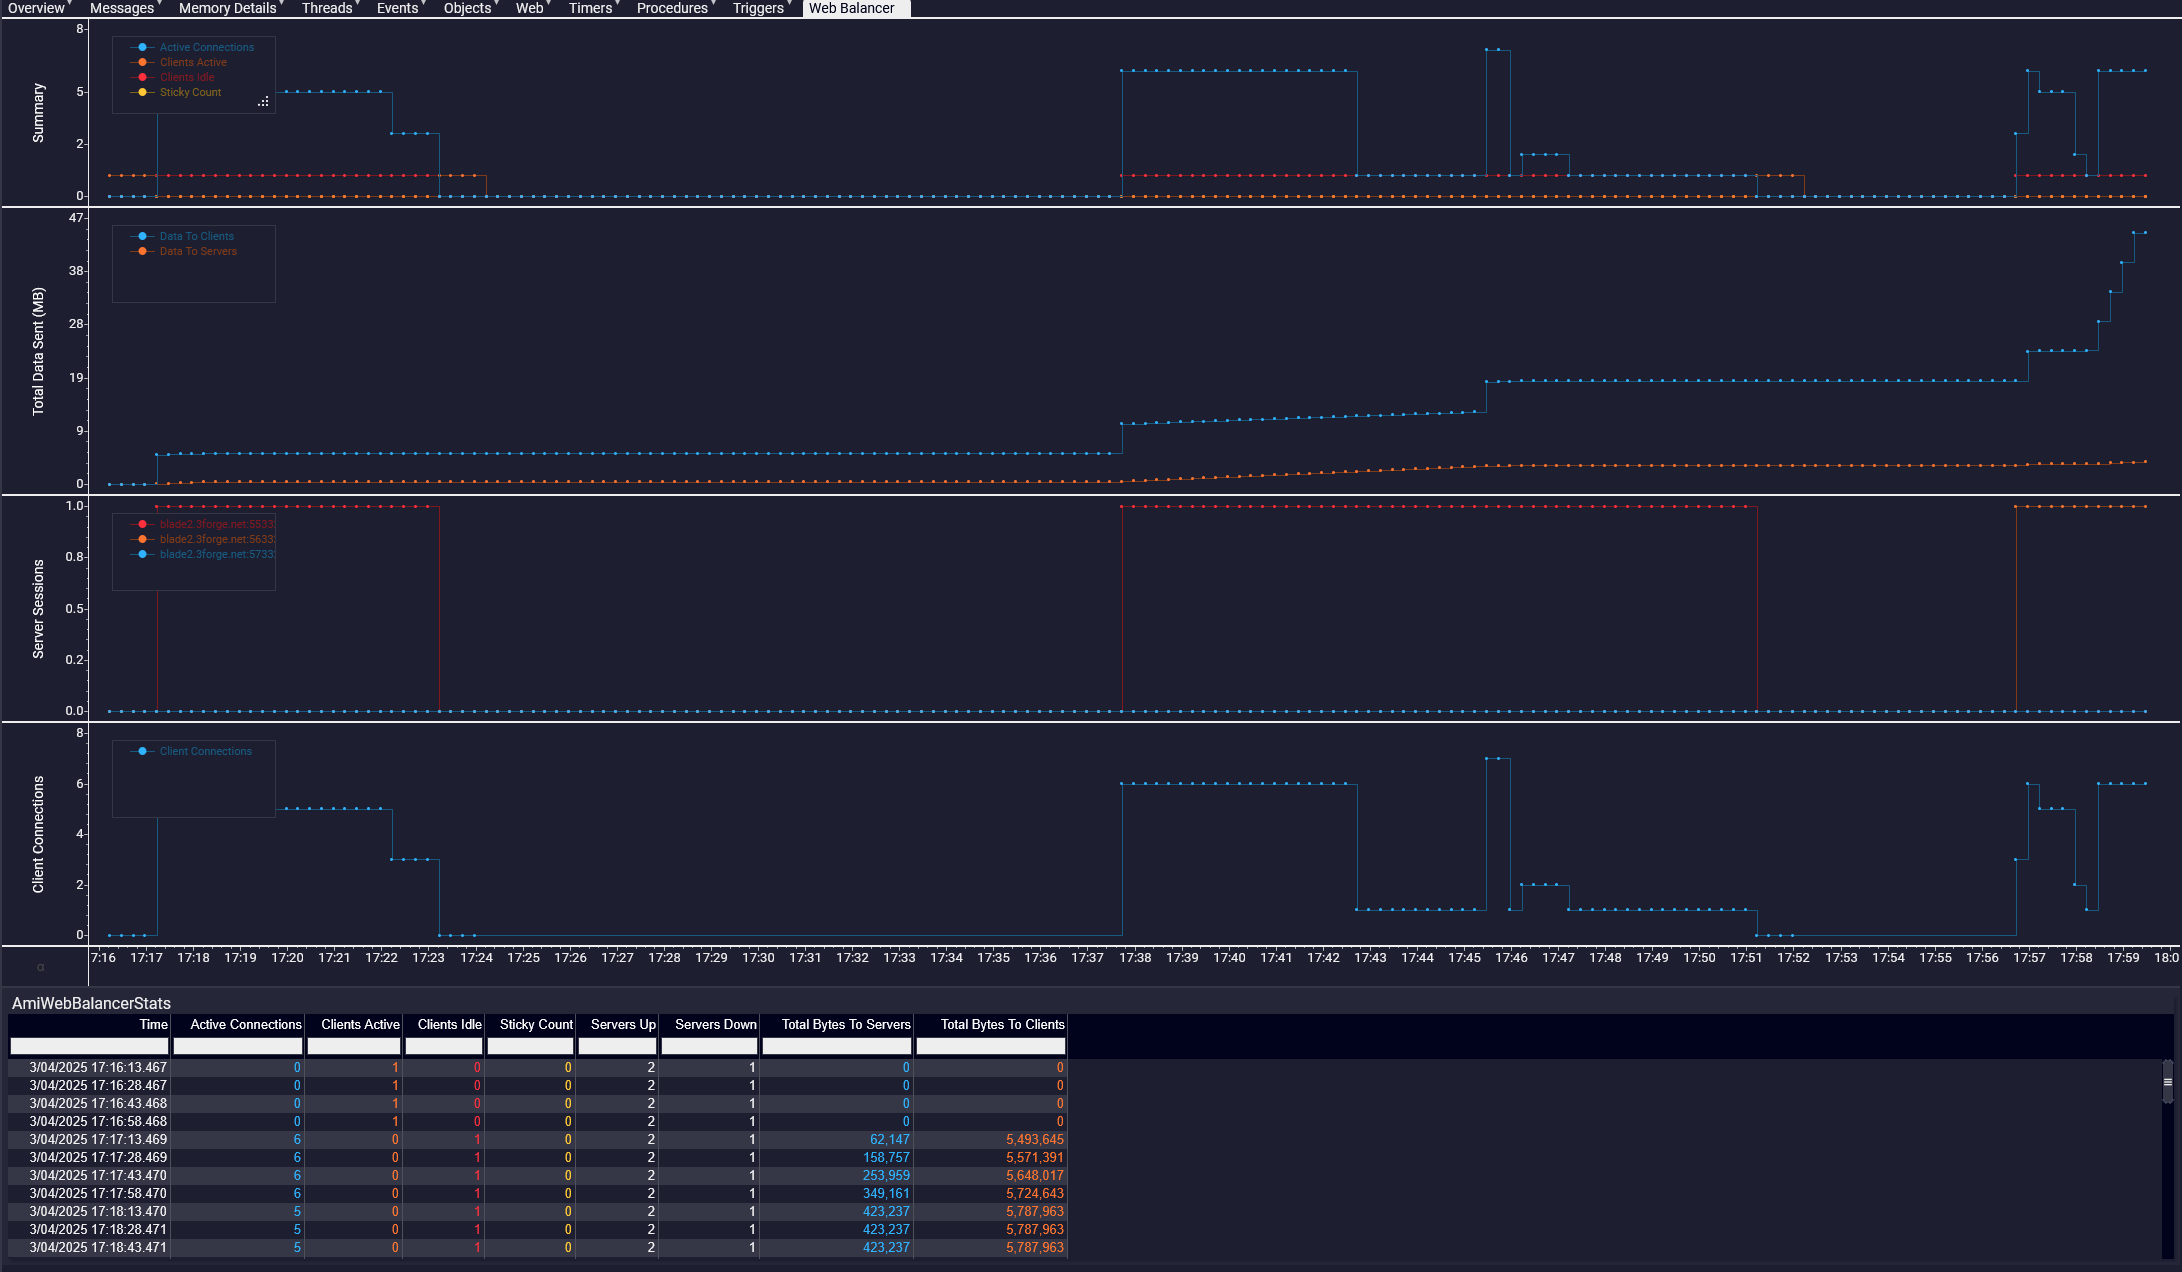
Load balancing
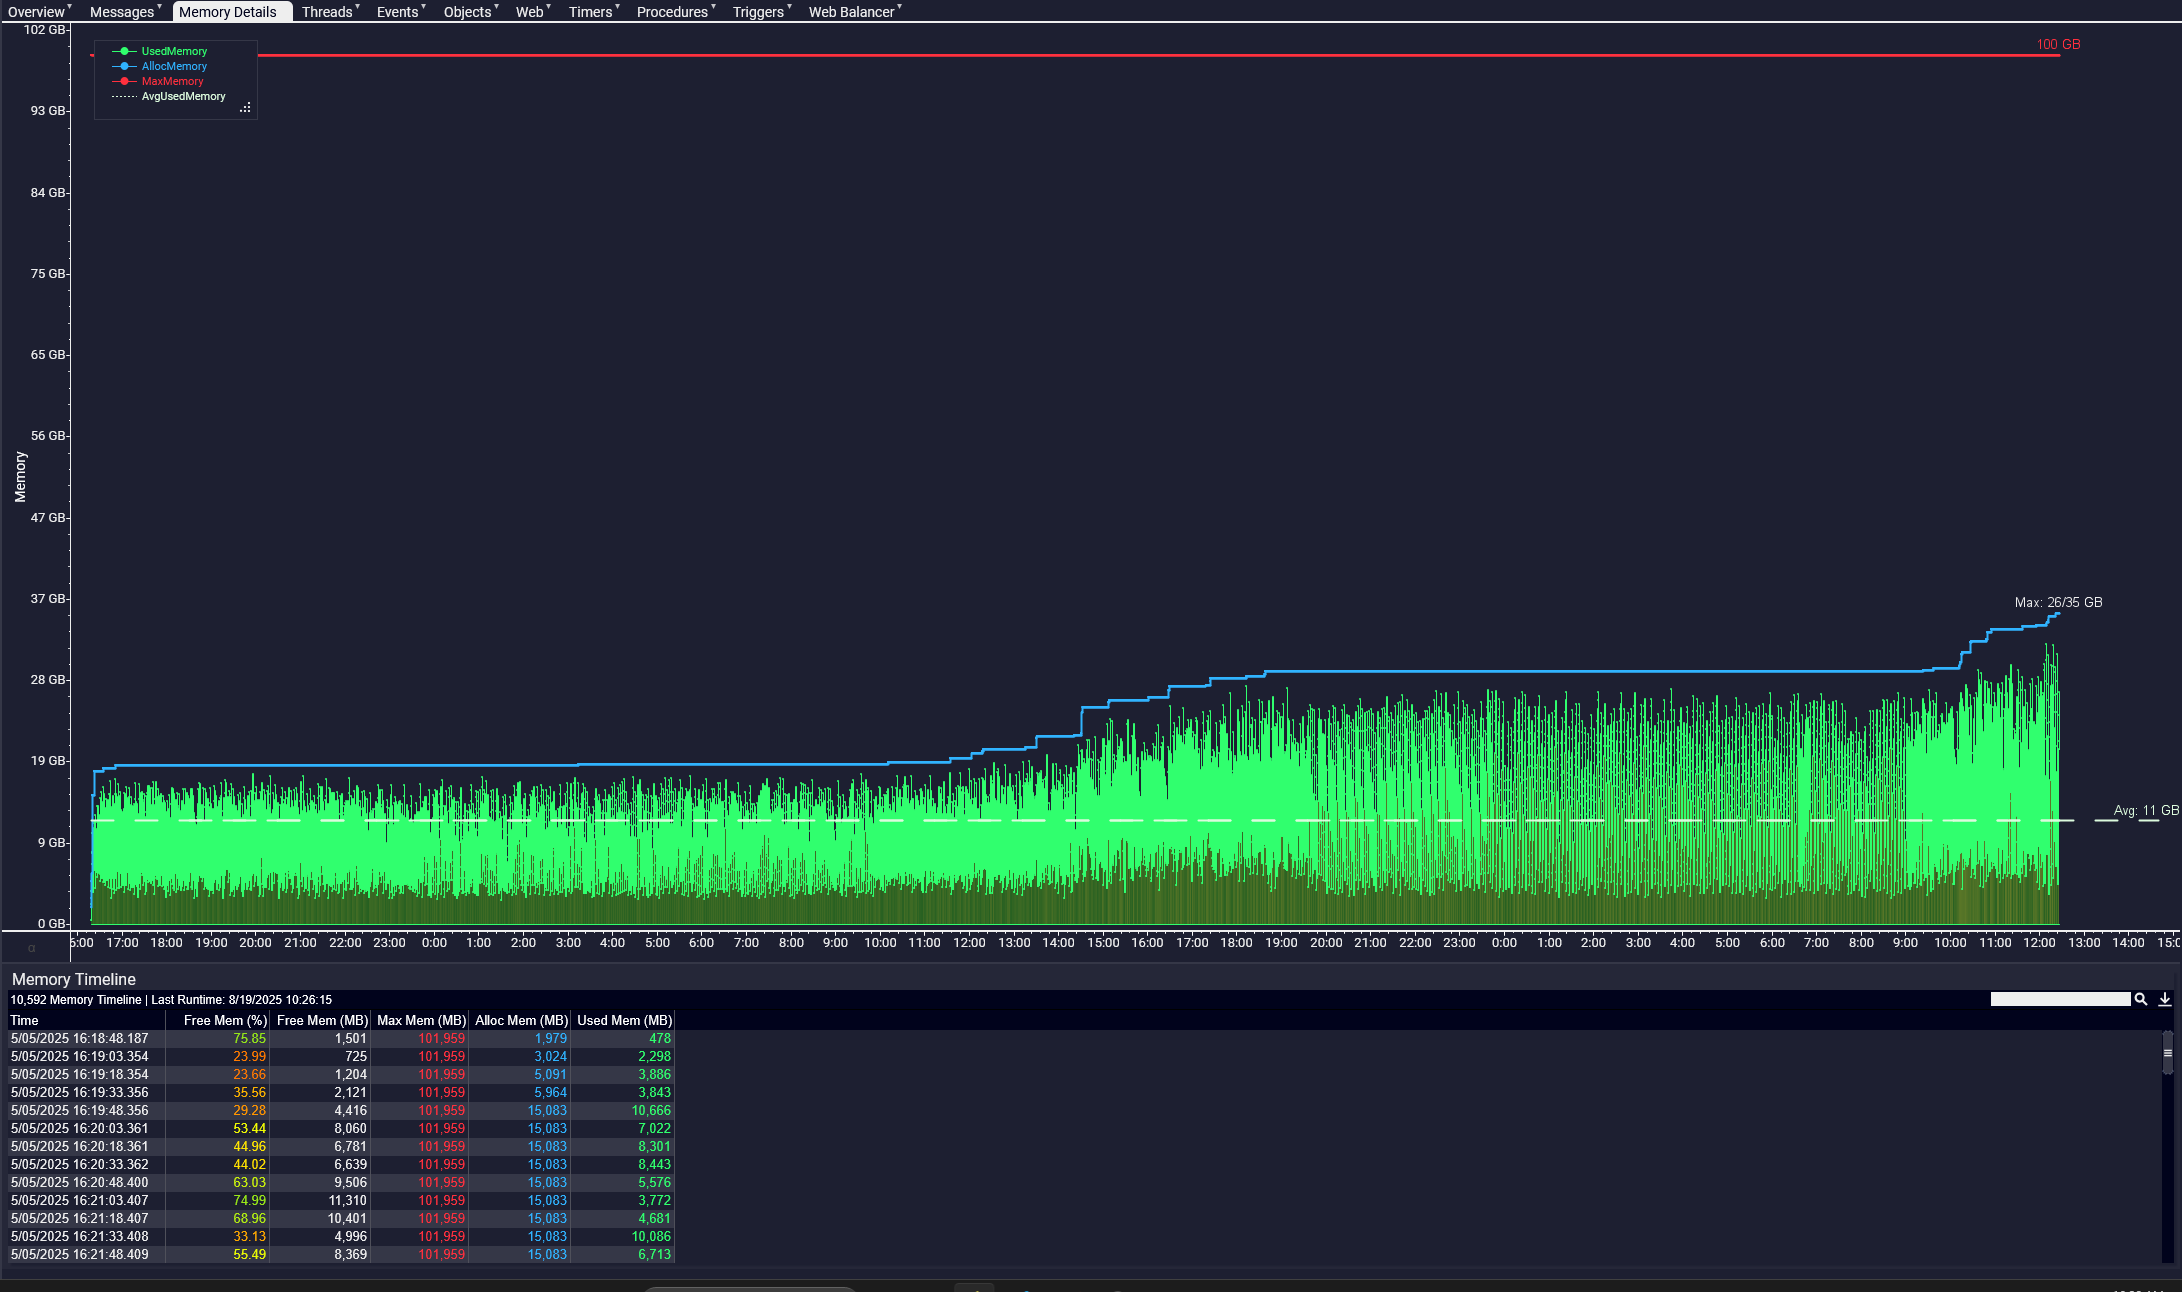
JVM memory allocation
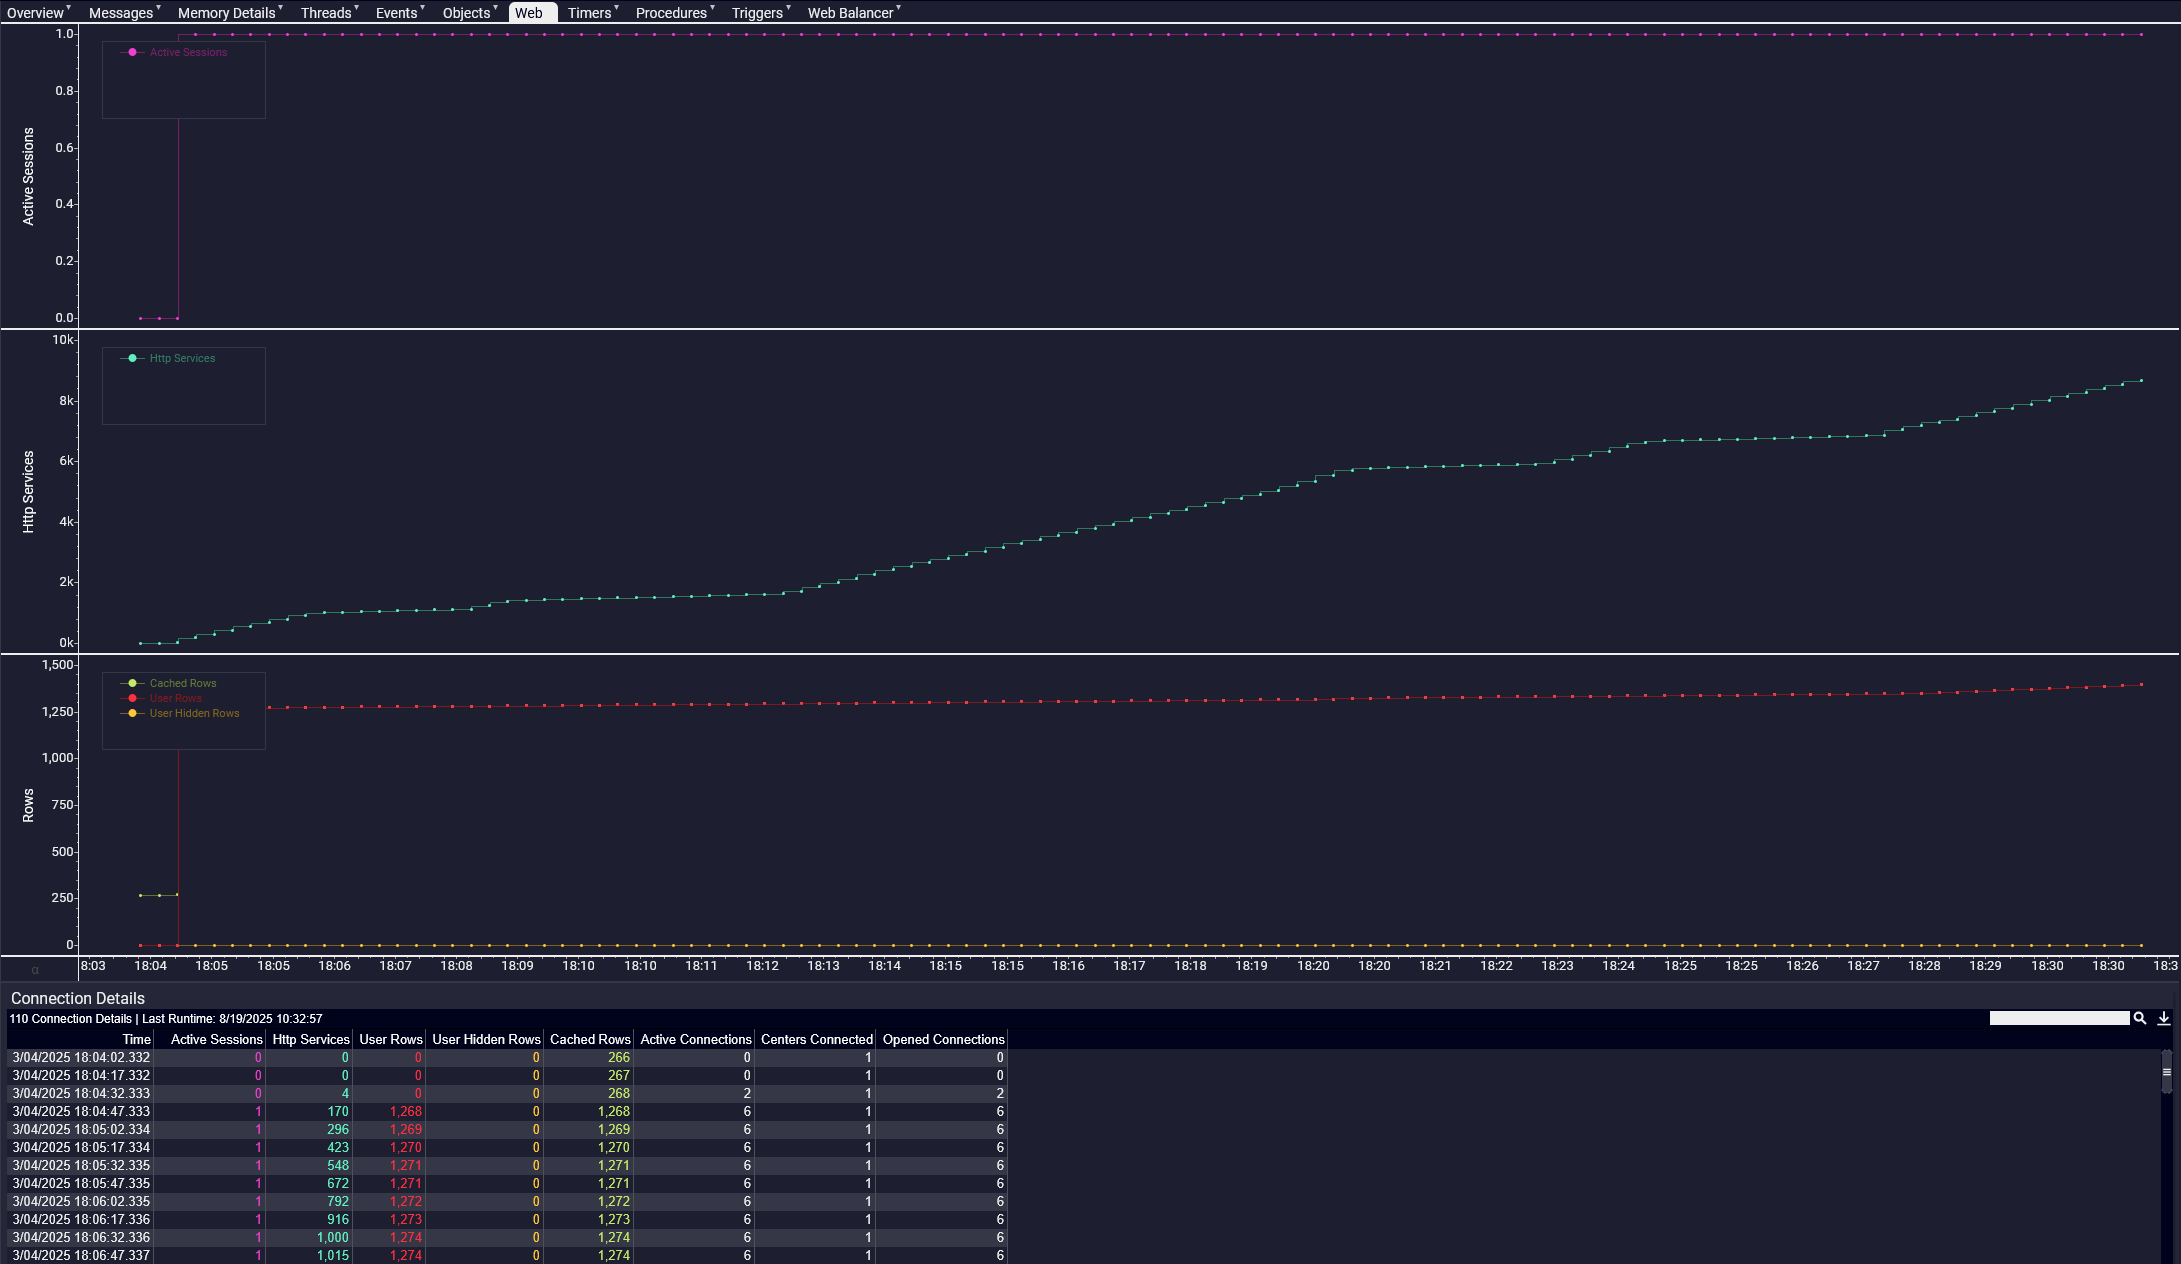
Queue processing metrics
Keep reading
The Workbench is where the work happens. AmiScript is what gets written.
One language across data, logic, workflows and presentation.