Firm Dashboard
Alternative investment managers juggle complex portfolios, diverse product structures, and rising investor expectations, with firm-level answers scattered across funds, systems, and spreadsheets. The Firm Dashboard brings every dimension of that data into one real-time, highly visual view, so executives and CIO teams can see firm-level performance, exposures, and revenue drivers the moment they need them. Enterprise-wide transparency for leadership teams.
The Challenge
Firm-Level Answers Are Scattered Across Funds and Spreadsheets
Leadership needs a consolidated, top-down view of the entire alternative investment program, but the data lives in separate fund systems, administrators, and manual workbooks. Assembling a firm-wide picture means waiting on stitched-together reports that are stale by the time they arrive, across private equity, credit, venture, infrastructure, hedge funds, and more.
Fragmented across products
Private equity, credit, venture, infrastructure, and hedge funds each report differently, in their own systems and formats, so there is no single place to see the whole firm.
Manual, spreadsheet-bound roll-ups
Firm-level aggregation depends on manual data collection and spreadsheets, which are slow to assemble, hard to audit, and easy to get wrong.
Inconsistent reporting
Without a standard view across asset classes and vehicles, numbers are hard to compare, reconcile, and trust at the enterprise level.
No real-time picture
By the time the firm-wide view is compiled, it is already out of date, leaving executives and CIO teams reacting to last month's numbers.
The 3forge Approach
One Seamless, Real-Time Firm View
The Firm Dashboard aggregates every fund product, private equity, credit, venture, infrastructure, hedge funds, and more, into a single enterprise view. 3forge unifies static and dynamic data across funds, investors, investments, fees, and revenue, then renders it as clear, interactive analytics, exposures, and trend visualizations. Leadership sees firm-level performance and revenue drivers in real time, with reporting standardized across asset classes and vehicles, and without manual data collection or spreadsheets. It is built for alternative investment managers, fund allocators such as family offices, endowments, and OCIOs, and multi-strategy managers overseeing diverse closed-end and open-end vehicles.
Key Capabilities
What You Can Build with 3forge
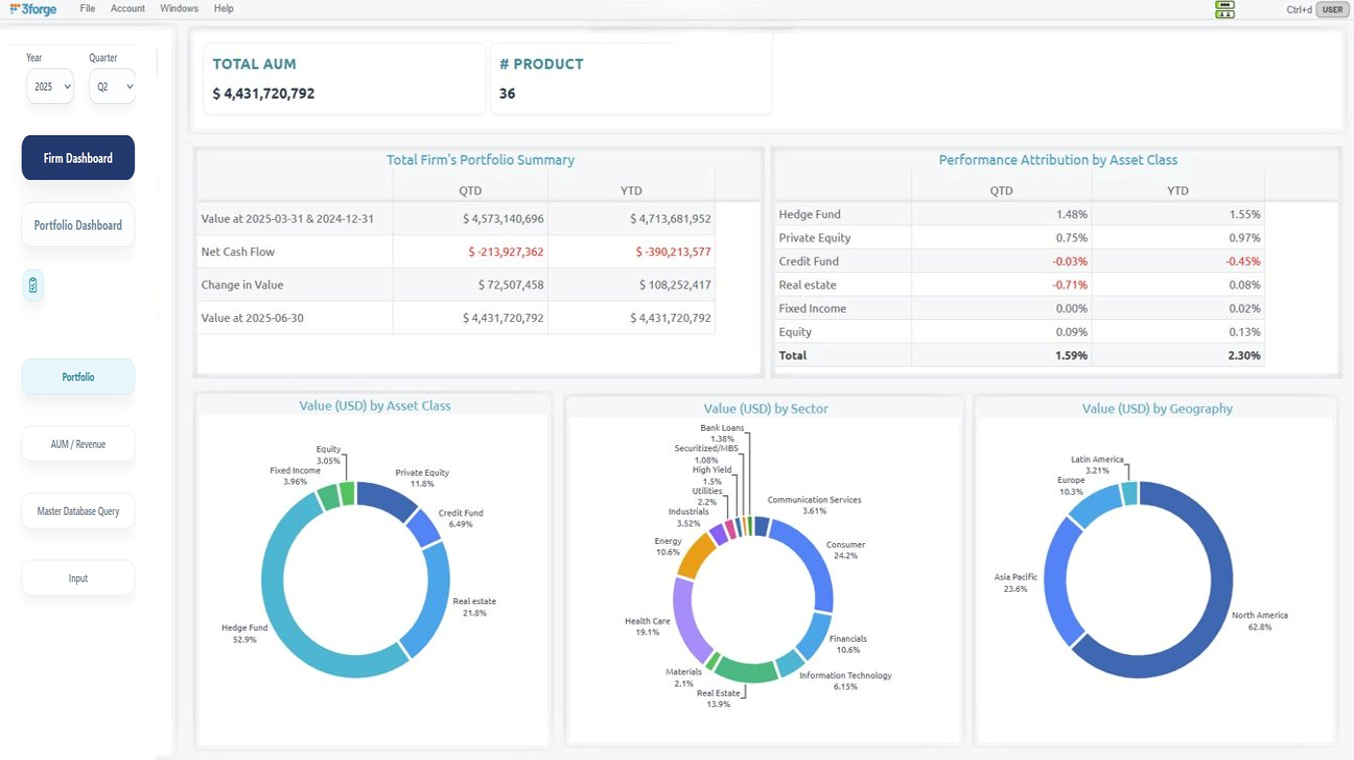
Firm-Wide Portfolio Overview
AUM, beginning value, net cash flow, change in value, and ending value at a glance, with composition broken down by asset class, sector, and geography over time.
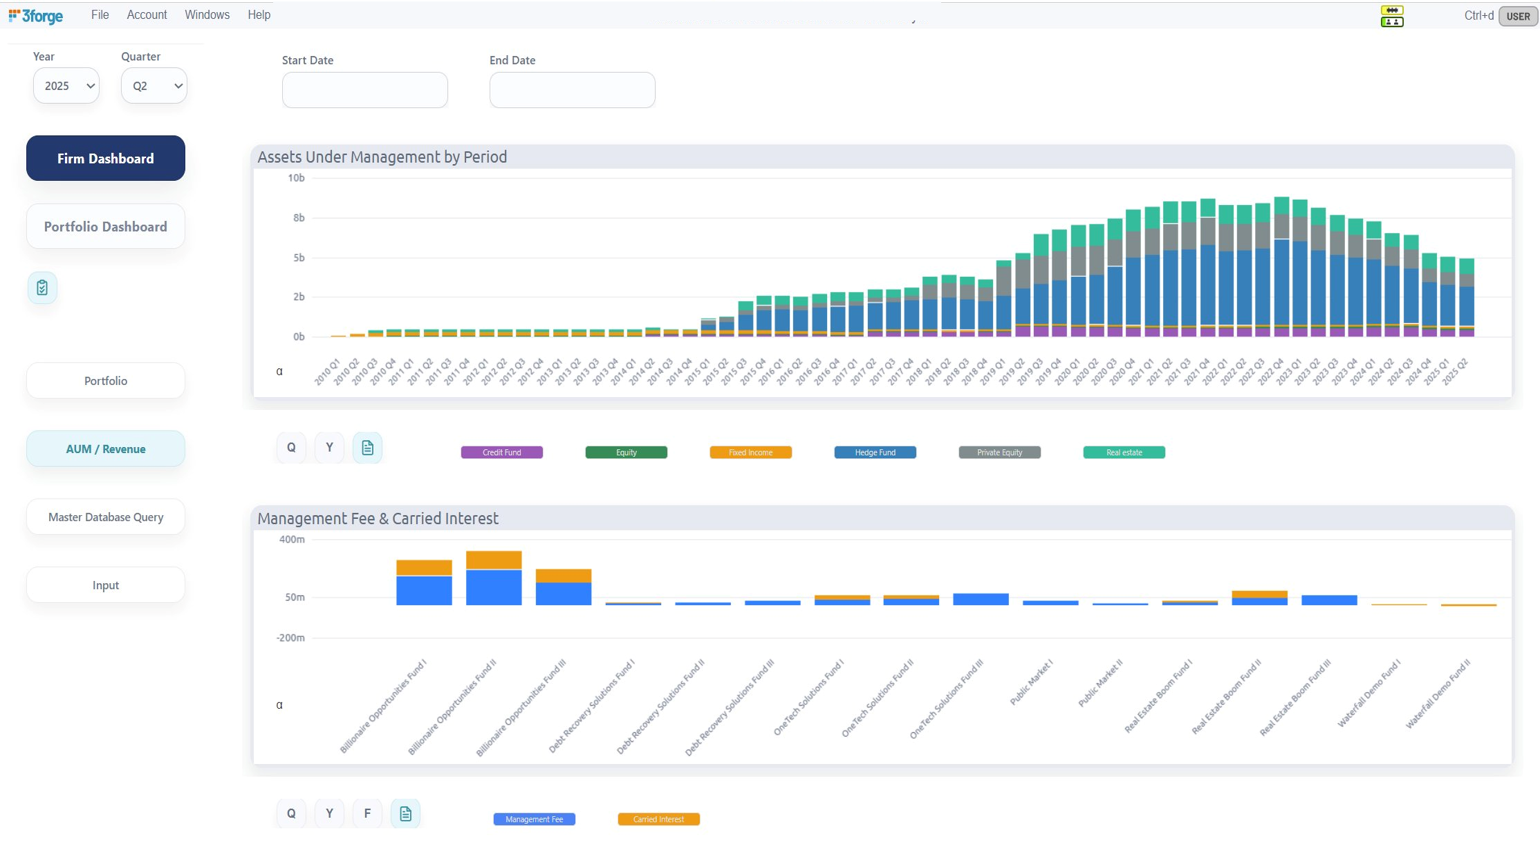
AUM & Revenue Tracking
Time-series of AUM and flows since inception, at total-firm level or by product type, alongside realized carried interest and management fee income.
Performance Attribution
Attribution by asset class on a QTD and YTD basis, so leadership understands exactly what is driving firm-level returns.
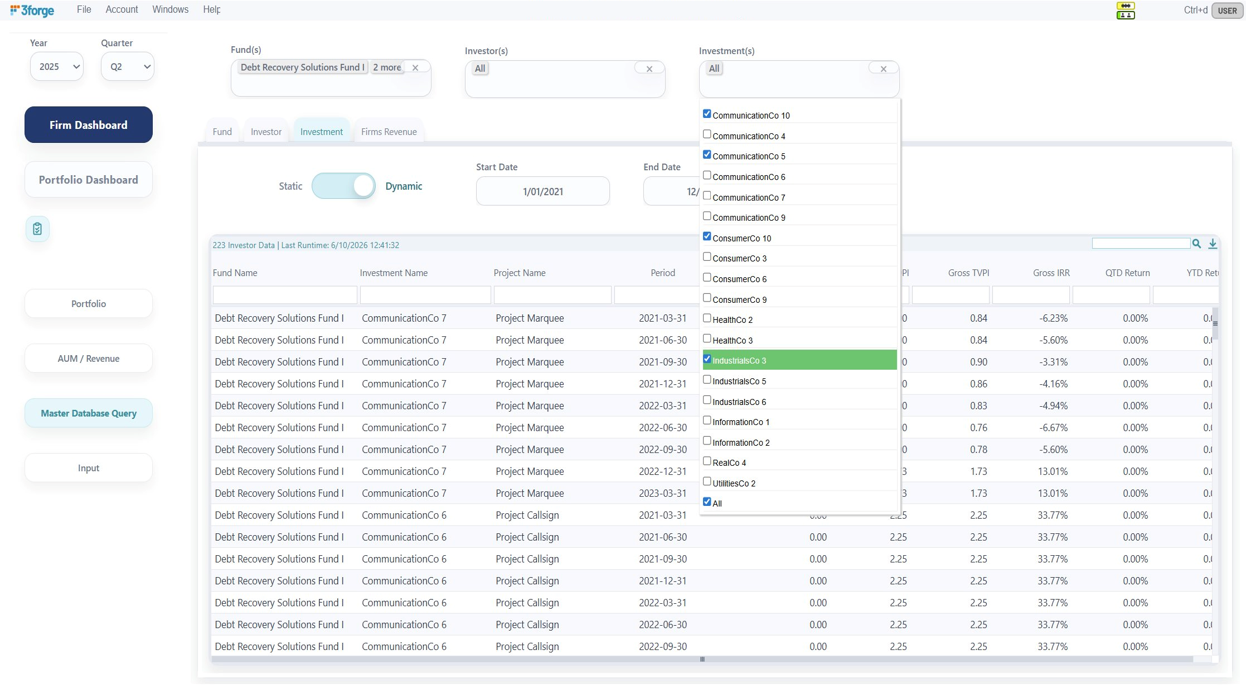
Master Database Query
A super-charged security master that consolidates static and dynamic data across funds, investors, investments, fees, and revenue for fast retrieval and reconciliation.
Standardized Reporting
One consistent view across asset classes and vehicles, so every product is measured and presented the same way.
No Manual Roll-Ups
Leadership insight without manual data collection or spreadsheets, drawn live from a single source of truth across the firm.
Inside the Platform
Portfolio Overview, Firm-Wide
A snapshot of the entire firm's portfolio, including AUM, beginning value, net cash flow, change in value, ending value, and performance attribution. Visualizations break down composition by asset class, sector, and geography, and can be analyzed over time.
AUM & Revenue Tracking
Time-series visualizations show how AUM and flows have evolved since inception, at the total-firm level or sliced by product type. Revenue analytics include realized and paid carried interest and management fee income, so leadership can see each product's financial contribution to the enterprise.
Master Database Query
A powerful research experience that consolidates static and dynamic data across funds, investors, investments, fees, and revenue. Like a super-charged security master, it lets teams quickly retrieve, reconcile, and analyze any information across the firm.
Get started
See your whole firm in one view
Book a 30-minute demo with a 3forge solutions engineer and see firm-wide performance, exposures, and revenue drivers in a single real-time dashboard.